In IELTS Writing Task 1 questions, a clear and distinct overview is an essential component. In other words, you have to write a short summary of the image you are given to describe.
So, how to write an overview for IELTS Writing Task 1?
Best practices dictate that this IELTS Writing Task 1 Overview or summary should be a separate paragraph either after the Introduction paragraph or at the end of description.
Among other criteria used for evaluation of Task 1 answers, the overview is important to fulfil the criterion of Task Achievement. Without writing a clear overview, candidates will not receive a score of 6.0 or higher under the criterion of Task Achievement.
Features of the IELTS Writing Task 1 Overview paragraph
- An overview is a short description of the main features from the image.
- It is best to write an overview as a separate paragraph after the Introduction paragraph.
- The IELTS Writing Task 1 summary should not be more than a few sentences long. Oftentimes, one or two sentences are enough.
- Data from the graph (numbers, values, and figures) should not be included in the overview. Only the main trends of the data or comparison between significance of the data should be included.
- Begin your IELTS Writing Task 1 Overview paragraph with any of the following words or phrases in order to demarcate it for the examiner:
- In summary,…
- To summarize,…
- In short,…
- To sum up,…
- Overall,…
What to write in the IELTS Writing Task 1 summary paragraph?
The content of the IELTS Writing Task 1 Overview paragraph depends on whether the image is static or dynamic.
While static graphs provide data for a single time period, dynamic graphs present data for multiple time periods. As a result, they have to be analyzed in different ways.
Overview for static graphs
As static graphs contain information for only one time period, we have to look at the biggest and the smallest values in the chart.
Look at the question below:
WRITING TASK 1
You should spend about 20 minutes on this task.
| The table below shows the percentage of Vietnam’s exports in various categories in 2016. Summarize the information by selecting and reporting the main features, and make comparisons where relevant. |
Write at least 150 words.
Vietnam’s Merchandise Exports 2016
| Merchandise | Share of total (%) |
|---|---|
| Crude oil | 1.3 |
| Agriculture products | 12.6 |
| Low-value manufacturing (garment, footwear, etc.) | 48.9 |
| High-value manufacturing (phones, computers, electronics, etc.) | 31.8 |
| Other | 5.4 |
In the table above, the biggest numerical data is 48.9 percent which is for Low-value manufacturing.
Similarly, the smallest number is 1.3 percent for Crude oil.
These two are the main features of this graph. We have to mention them in our IELTS Writing Task 1 Overview paragraph.
| Overview: |
|---|
| In summary, low-value manufacturing commodities had the largest share of total exports by Vietnam in 2016. On the other hand, only a small proportion of total exports was occupied by crude oil. |
Do not mention the data (numbers) in the IELTS Writing Task 1 Overview paragraph. Write which items have large values and which have small values without writing the numbers.
Let’s take one more example to better understand IELTS Writing Task 1 Overview:
WRITING TASK 1
You should spend about 20 minutes on this task.
| The charts below show the marital status of men and women in Iran in 2016. Summarize the information by selecting and reporting the main features, and make comparisons where relevant. |
Write at least 150 words.
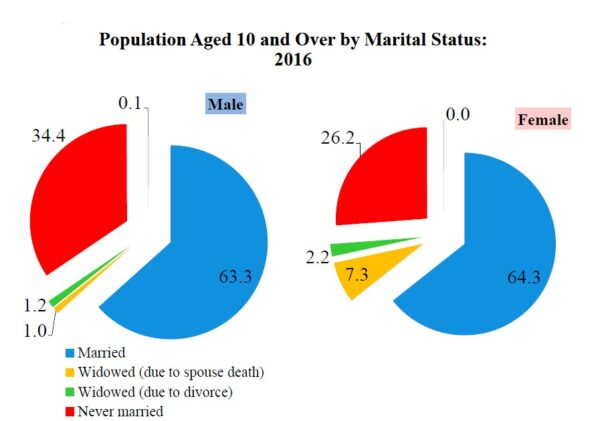
Firstly, the data in pie charts are almost always expressed in percentage form, so the numbers in the charts above are percentages.
You might notice there is a 0.1 percent data in the chart for males and a 0.0 percent in the chart for female. These are other variables which have not been classified separately. We can ignore such insignificant data for our analysis.
Now, in the first pie chart, the biggest slice of the pie is for married men which stands at 63.3 percent, whereas the smallest slice belongs to widowers and their percentage is 1.0.
In the same vein, in the chart for females, 64.3 percent is the largest number and it belongs to married women. Meanwhile, divorcee women have the tiniest share of total population with a value of 2.2 percent.
Now let’s look at a sample IELTS Writing Task 1 summary which encapsulates these findings.
| Overview: |
|---|
| To summarize, married people formed a vast majority of the Iranian population above the age of 10 in the year 2016. Furthermore, widowers had the smallest population among men, while divorcees were the tiniest minority among women. |
WRITING TASK 1
You should spend about 20 minutes on this task.
| The chart below shows the quantities of pineapple produced in various regions of the Philippines in the first quarter of 2021. Summarize the information by selecting and reporting the main features, and make comparisons where relevant. |
Write at least 150 words.
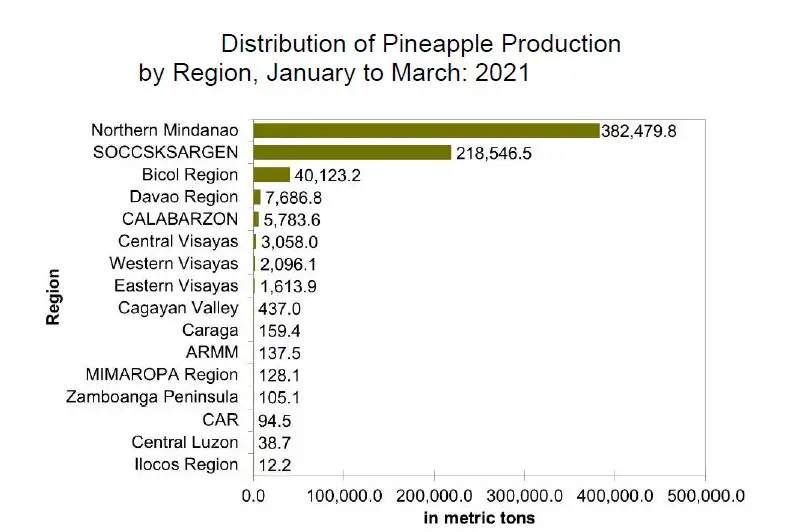
Although the information here is for three months, it is still a static diagram because the three months have been taken as a single period.
It is very clear to see the biggest and the smallest numbers in the bar diagram. However, sometimes we can look at static graphs from a different perspective:
Notwithstanding the numbers, what visual features stand out from the graph?
Try with the graph above. One element that is evident from the graph is that three regions of the Philippines, namely Northern Mindanao, SOCCSKSARGEN, and Bicol Region, had produced significantly larger quantities of pineapple than others, so much so that the bars for other regions are barely visible in the chart.
So, you can use your own wisdom and include such stand out features in your IELTS Writing Task 1 Overview paragraphs rather than simply focusing on the biggest or the smallest numbers in the graph.
| Overview: |
|---|
| In short, from January to March 2021, production of pineapples in Northern Mindanao, SOCCSKSARGEN, and Bicol Region far outstripped the production in other regions of the Philippines. |
IELTS Writing Task 1 Overview: Dynamic graphs
Dynamic graphs contain information for more than one period of time. The word “dynamic” means “change“, hence in dynamic graphs we can notice the increase or decrease in the numbers over time.
Here is an example:
WRITING TASK 1
You should spend about 20 minutes on this task.
| The graph below shows the total number of visits to the UK by overseas residents and UK residents’ visits abroad between 2000 and 2020. Summarize the information by selecting and reporting the main features, and make comparisons where relevant. |
Write at least 150 words.
Visits to and from the UK 2000 to 2020
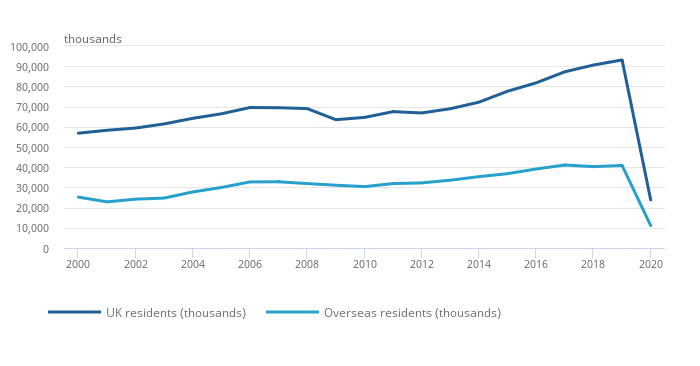
From the above graph, we can deduce that throughout the period, more international visits were made by UK residents than the number of visits to the UK made by foreigners. However, unlike static charts, this information is not the most significant feature of this dynamic line graph.
We have to focus on change over time. So, our attention should be towards the increase or decrease of the numbers.
With some fluctuations in the middle, the number of abroad visits from the UK had risen from almost 60 million in the year 2000 to over 90 million in the year 2019. This number had nosedived to around 25 million in 2020.
Moreover, the number of times overseas residents visited the UK had climbed from approximately 25 million in 2000 to 40 million in 2019. By 2020, this figure had slumped to about 10 million.
So, these changes have to be mentioned in the IELTS Writing Task 1 Overview paragraph of dynamic graphs. Remember, we do not mention the raw numbers; just the fact whether there was an increase or a decrease in the numbers.
| Overview: |
|---|
| To sum up, there was a gradual growth in the number of overseas visits by UK residents as well as the number of visits to the UK from overseas over the period, except at the very end when the numbers had fallen dramatically after 2019. |
Another example:
WRITING TASK 1
You should spend about 20 minutes on this task.
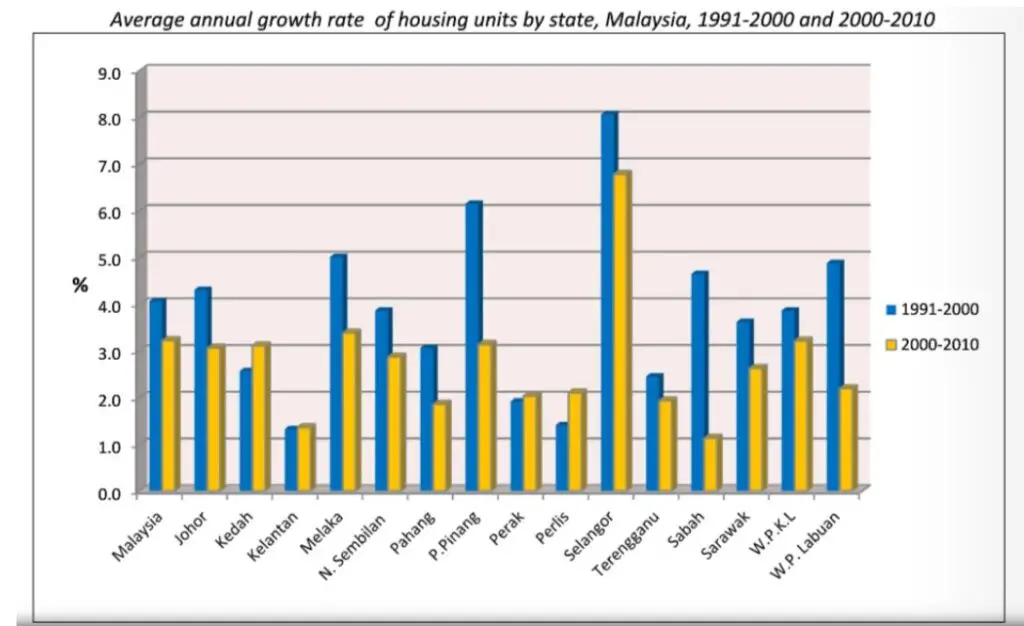
| The bar graph below shows the average annual rate of growth of housing in different states of Malaysia in the periods 1991-2000 and 2000-2010. Summarize the information by selecting and reporting the main features, and make comparisons where relevant. |
Write at least 150 words.
When dealing with a vast amount of data, it is best to group items together.
As this is a dynamic chart, some values have increased while others have decreased.
| States where annual growth rate of housing had increased | States where annual growth rate of housing had decreased |
|---|---|
| Kedah, Kelantan, Perak, Perlis | Johor, Melaka, N. Sembilan, Pahang, P. Pinang, Selangor, Terengganu, Sabah, Sarawak, W.P.K.L, W.P. Labuan |
We can also figure out the size of increase or decrease among the items in a dynamic graph. By how much a number has risen or fallen will tell us about the type of change, so that we could include the big changes in our IELTS Writing Task 1 Overview.
In the above graph, the biggest change is the decrease of average annual growth rate of housing units in Sabah from 4.5 percent over 1991-2000 to 1 percent over 2000-2010.
| Overview: |
|---|
| Overall, except in Kedah, Kelantan, Perak, and Perlis, the average annual growth rate of housing had dropped in all the states of Malaysia in the period from 2000 to 2010 compared with the period from 1991 to 2000. Furthermore, the most significant decline had occurred in the state of Sabah. |
Next lesson:
Gaurav Thapa is an experienced instructor of English as a Foreign Language. He has eight years of experience teaching IELTS and PTE.
I’m not an IELTS examiner, but I have taught IELTS exam strategies for over twenty years now. Overall your advice here is excellent. I do, however, disagree slightly with one part of your advice. I tell my students to write the overview immediately after the introduction, and then follow it up with the detailed description of the chart. The main reason for this is that it makes it very clear to the examiner that the candidate has written an overview. Another reason is that many candidates will do Task 1 after they write Task 2. If a candidate runs out of time before finishing Task 1 at least they will have completed the overview. This can make a significant difference to their score for Task 1.
You have made a brilliant point sir. I have mentioned in the beginning of this article that the overview can be written as the second paragraph or the last paragraph. But as you have stated, writing it immediately after the introduction would be better. Thank you for your comment.